

Solo in FieldQuo
The KPI dashboard
One screen for sales, money flow, business costs, profit, execution, quality, cash and customer — the period buttons, what each section holds, how a card reads when it has no data, and who can open it.
Per ora questo articolo è disponibile in inglese, francese e spagnolo. Stai leggendo la versione inglese. Français · Español
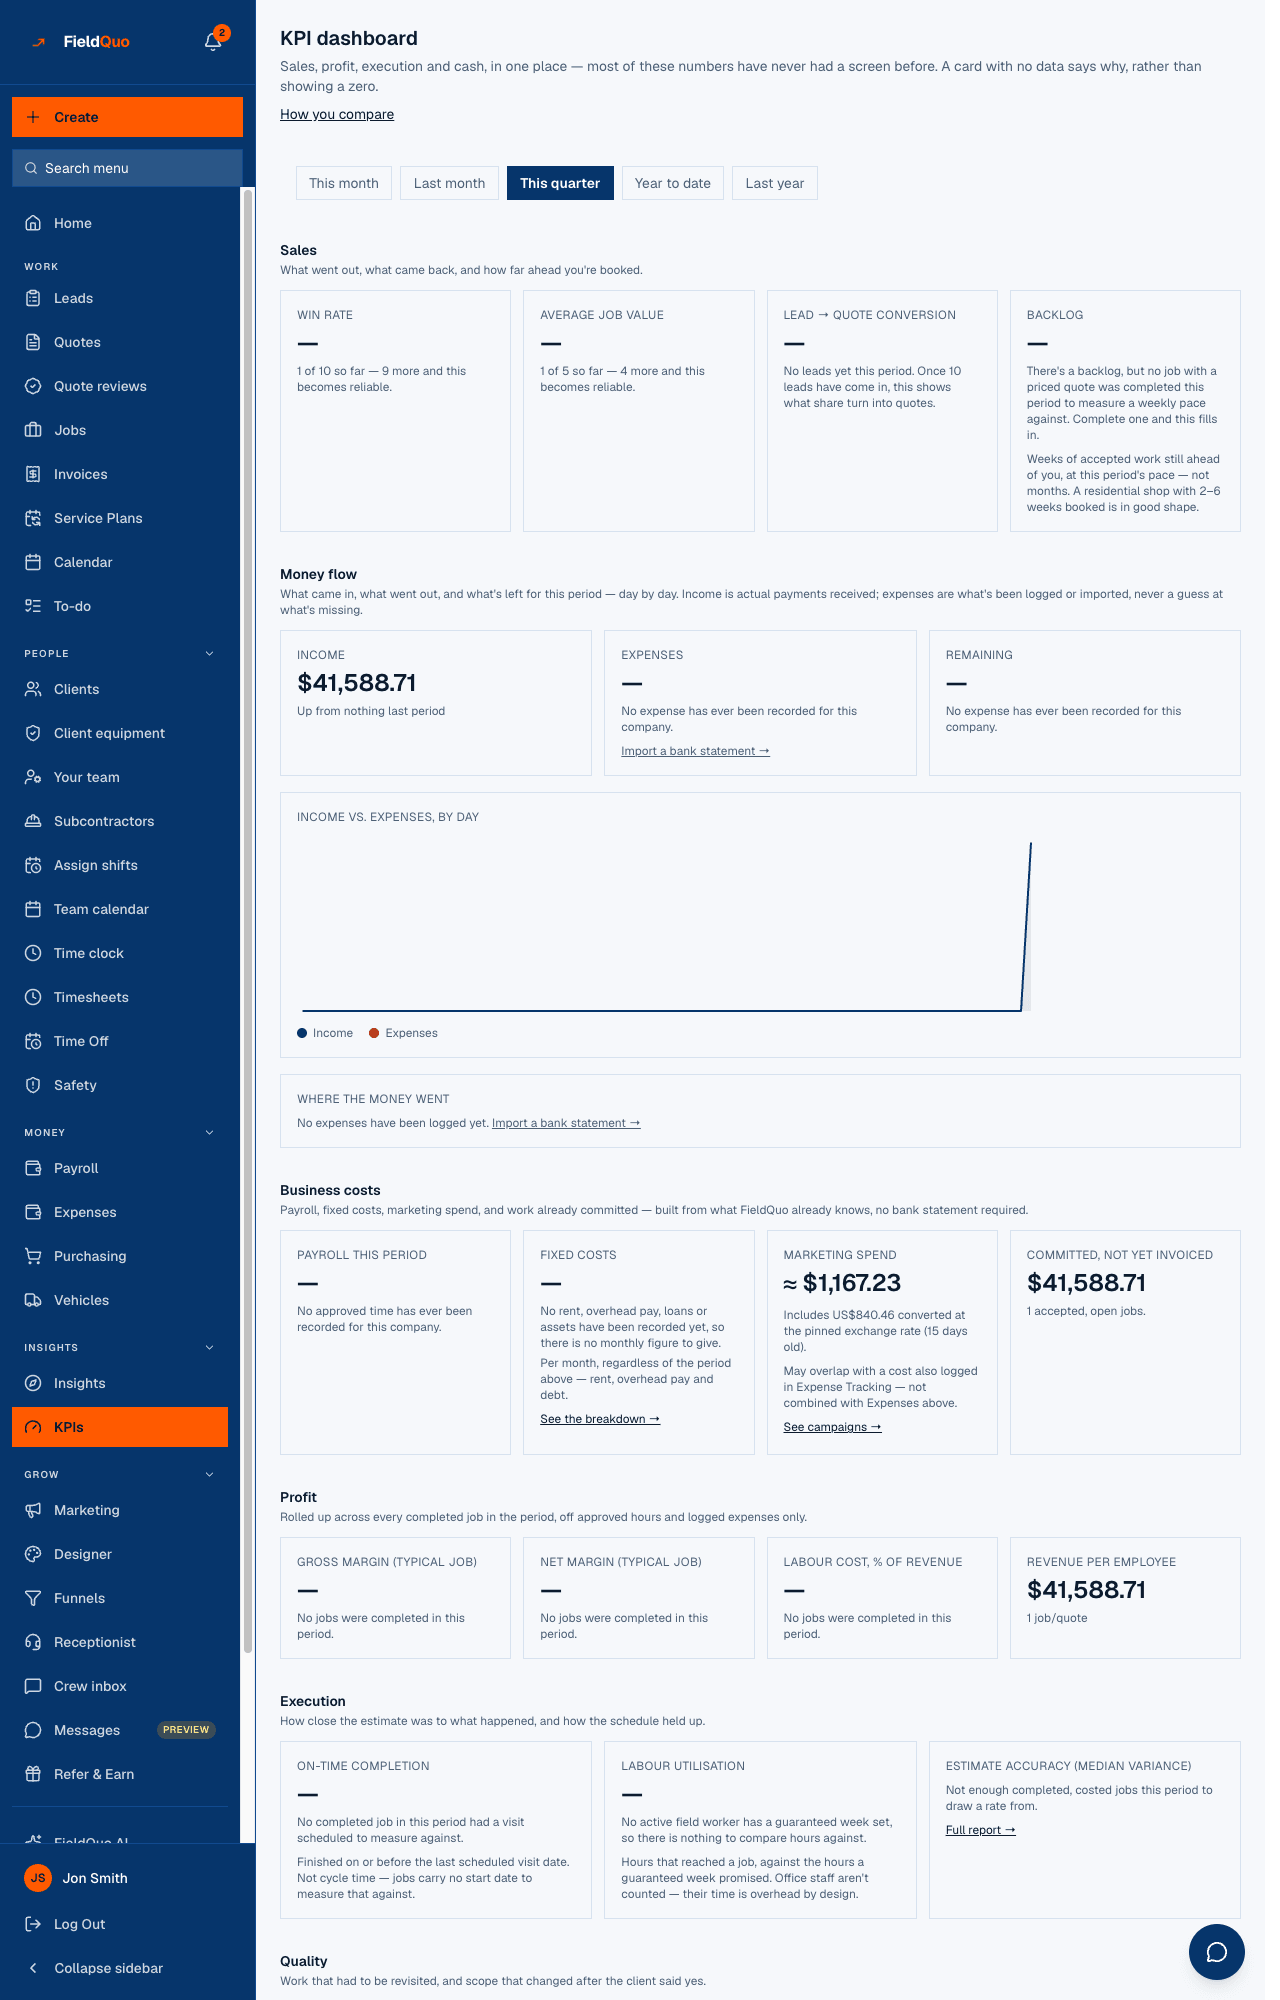
KPI dashboard — Sales, profit, execution and cash, in one place — most of these numbers have never had a screen before. A card with no data says why, rather than showing a zero. That subtitle is the design: one period selector, nine sections, and a rule that a card either prints a number it can stand behind or says in words why it cannot.
This article is the map of the screen — the period buttons, the sections and what each holds, how to read a card, and who can open the page. Each section has its own article with every card's exact definition.
Overview
The page lives under Insights → KPIs in the sidebar, with a How you compare link back to the Insights hub. Nothing on it is computed a second time: the win rate is the Won and lost report's, accounts receivable is the dashboard's, estimate accuracy is the Estimate accuracy report's — so a figure here can never disagree with the screen it came from.
The period
Five buttons choose the period, and one choice governs every section. The default is This quarter. Periods are calendar periods on the UTC calendar — the same calendar every report uses — so two screens never disagree about which month a document belongs to.
- This month — the 1st to the last day of the current month.
- Last month — the whole previous month.
- This quarter — the current calendar quarter, to its last day.
- Year to date — January 1st to today.
- Last year — January 1st to December 31st of last year.
This month and This quarter run to the end of the period, not to today. The cards that compare against a prior period allow for that — see KPIs: Money flow — so a quarter three days old is not measured against a full one.
The sections
| Section | Cards | Article |
|---|---|---|
| Sales | Win rate · Average job value · Lead → quote conversion · Backlog | KPIs: Sales |
| Money flow | Income · Expenses · Remaining · Income vs. expenses, by day · Where the money went | KPIs: Money flow |
| Business costs | Payroll this period · Fixed costs · Marketing spend · Committed, not yet invoiced | KPIs: Business costs |
| Profit | Gross margin (typical job) · Net margin (typical job) · Labour cost, % of revenue · Revenue per employee | KPIs: Profit |
| Execution | On-time completion · Labour utilisation · Estimate accuracy (median variance) · Recent jobs: scheduled window vs. completion | KPIs: Execution |
| Quality | Rework / callback rate · Change-order rate | KPIs: Quality |
| Cash | Accounts receivable, by age · Money received, last 6 months | KPIs: Cash |
| Customer | Customer satisfaction · Answers by score | KPIs: Customer |
| Not tracked | The metrics the page names and refuses to invent | The metrics FieldQuo refuses to invent |
How to read a card
- A value in large type, and under it the sample it was drawn from — “24 jobs/quotes”. A rate without its denominator is a number you have to trust rather than check, so the count is always beside it.
- A — and a sentence when there is no value: “1 of 10 so far — 9 more and this becomes reliable.”, “No jobs were completed in this period.”, “No leads yet this period.” The sentence is the card's reason, never a placeholder.
- A warning triangle when the number is real but knowably short — hours with no pay rate, materials bought off the buy-list and never expensed — with “some data missing, see below”. The figure is shown; it is not averaged over the gap.
- Two floors. A percentage (win rate, conversion, on-time completion, rework, change orders) needs 10 decided outcomes; a central figure over jobs (average job value, the margins, labour cost, satisfaction) needs 5. Below the floor the card counts what it has and says how many more it needs.
- An ≈ before a money figure means part of it was converted from another currency at the pinned rate; the hint under the tile names the original amount and how old the rate is.
What the other tools do not do
This dashboard is not on FieldQuo's public comparison table yet — the feature matrix leaves it off until a features page exists for it, rather than claim a row nobody can read. What the code does that a generic dashboard does not: a card under its sample floor prints no percentage at all, a knowably short figure is flagged instead of smoothed, and a section called Not tracked names the metrics it will not fabricate.
Where a piece of it is listed by a competitor, the matrix says so: job costing is on Jobber's Grow tier and QuoteIQ's Pro tier, which is why Job costing is not marked as unique to FieldQuo.
Who can see it
The page is all-or-nothing: the server refuses the KPI request unless the member holds View only or better on Quotes, Jobs, Invoices and Requests, sees every job rather than only assigned ones, and has both the See prices and Job costing switches. The sidebar row is hidden on the Job costing switch alone; a bookmarked address is stopped by the same check.
- With the presets: Crew, Estimator and Dispatcher are refused — none of them holds Job costing. Manager, owners and administrators see the page.
- Money flow has its own gate inside the page — Invoices at View only, Expenses at View, record, and edit everyone's, See prices — and refuses inside the section, not the whole page. Manager passes.
- Business costs is narrower again: Job costing plus View everyone's payslips on Payroll plus people management. With the presets that is owners and administrators; a Manager sees the rest of the page and a refusal in that section.
Domande frequenti
Why does a card say — when I know the number?
Because the page will not print a figure below its floor or with no evidence. The sentence under the dash says what is needed — usually more decided quotes or more completed jobs in the period.
Can I pick my own dates?
No. Five presets, and one selection for the whole page. The Financial statements page uses the same five.
Where is safety?
The KPI page carries no safety card today. Incidents are recorded and listed on the Safety screen; the per-1,000-hours rate the API computes has no card yet.
È stato utile?