

FieldQuo 独有
How You Compare: your prices against the platform
Insights opens on an anonymised pricing comparison: your average per service category against every opted-in company's average — how to opt in, exactly what goes into the average, and what the page never shows.
本文目前提供英语、法语和西班牙语版本。您正在阅读英语版本。 Français · Español
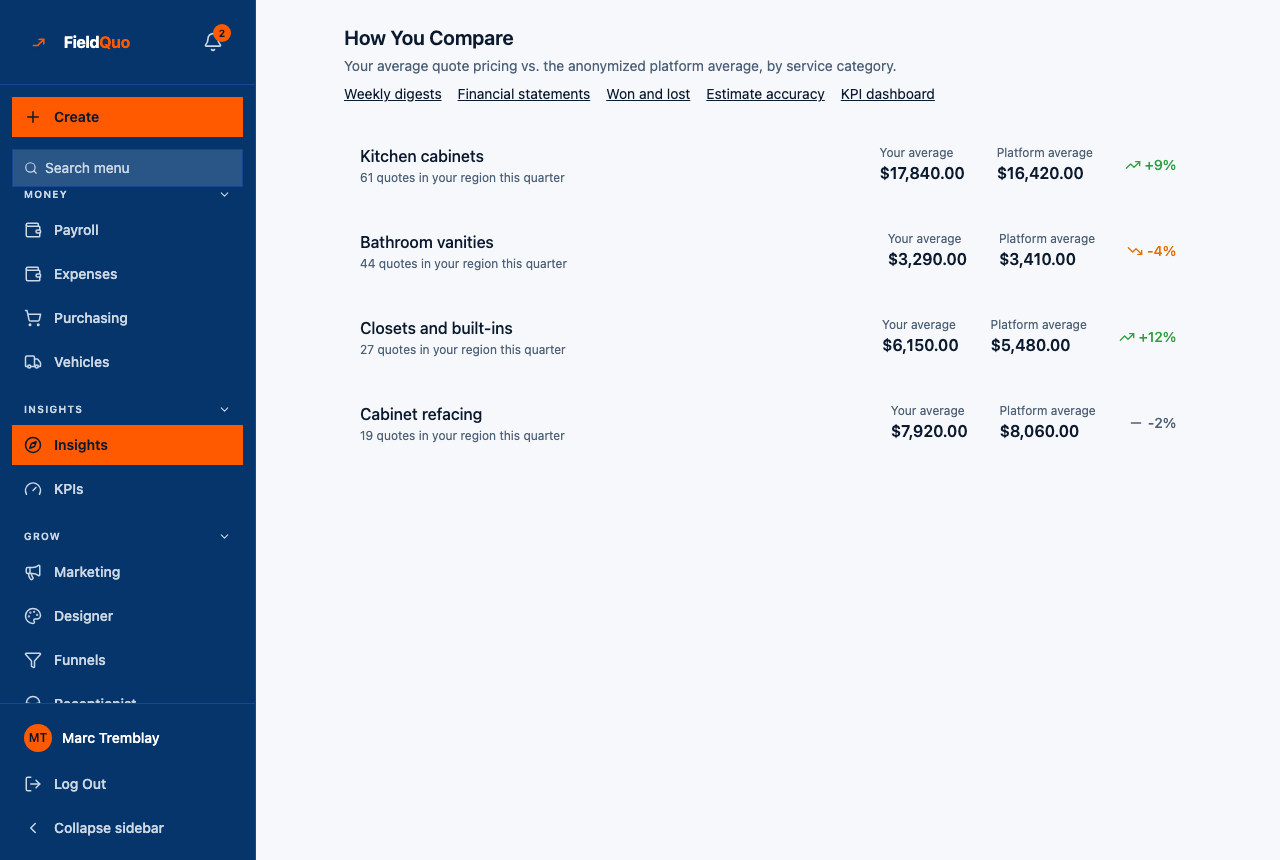
How You Compare — Your average quote pricing vs. the anonymized platform average, by service category. Insights opens on this page: for each service category you have switched on, what you charge on average against what every other company that opted in charges, and the difference as a percentage.
It is opt-in, it is aggregates only, and it never shows another company's quote. Every other report in FieldQuo answers about your own data alone; this is the one screen where other tenants' numbers appear at all, pooled and anonymised. This article says exactly what goes into the average and what does not.
Overview
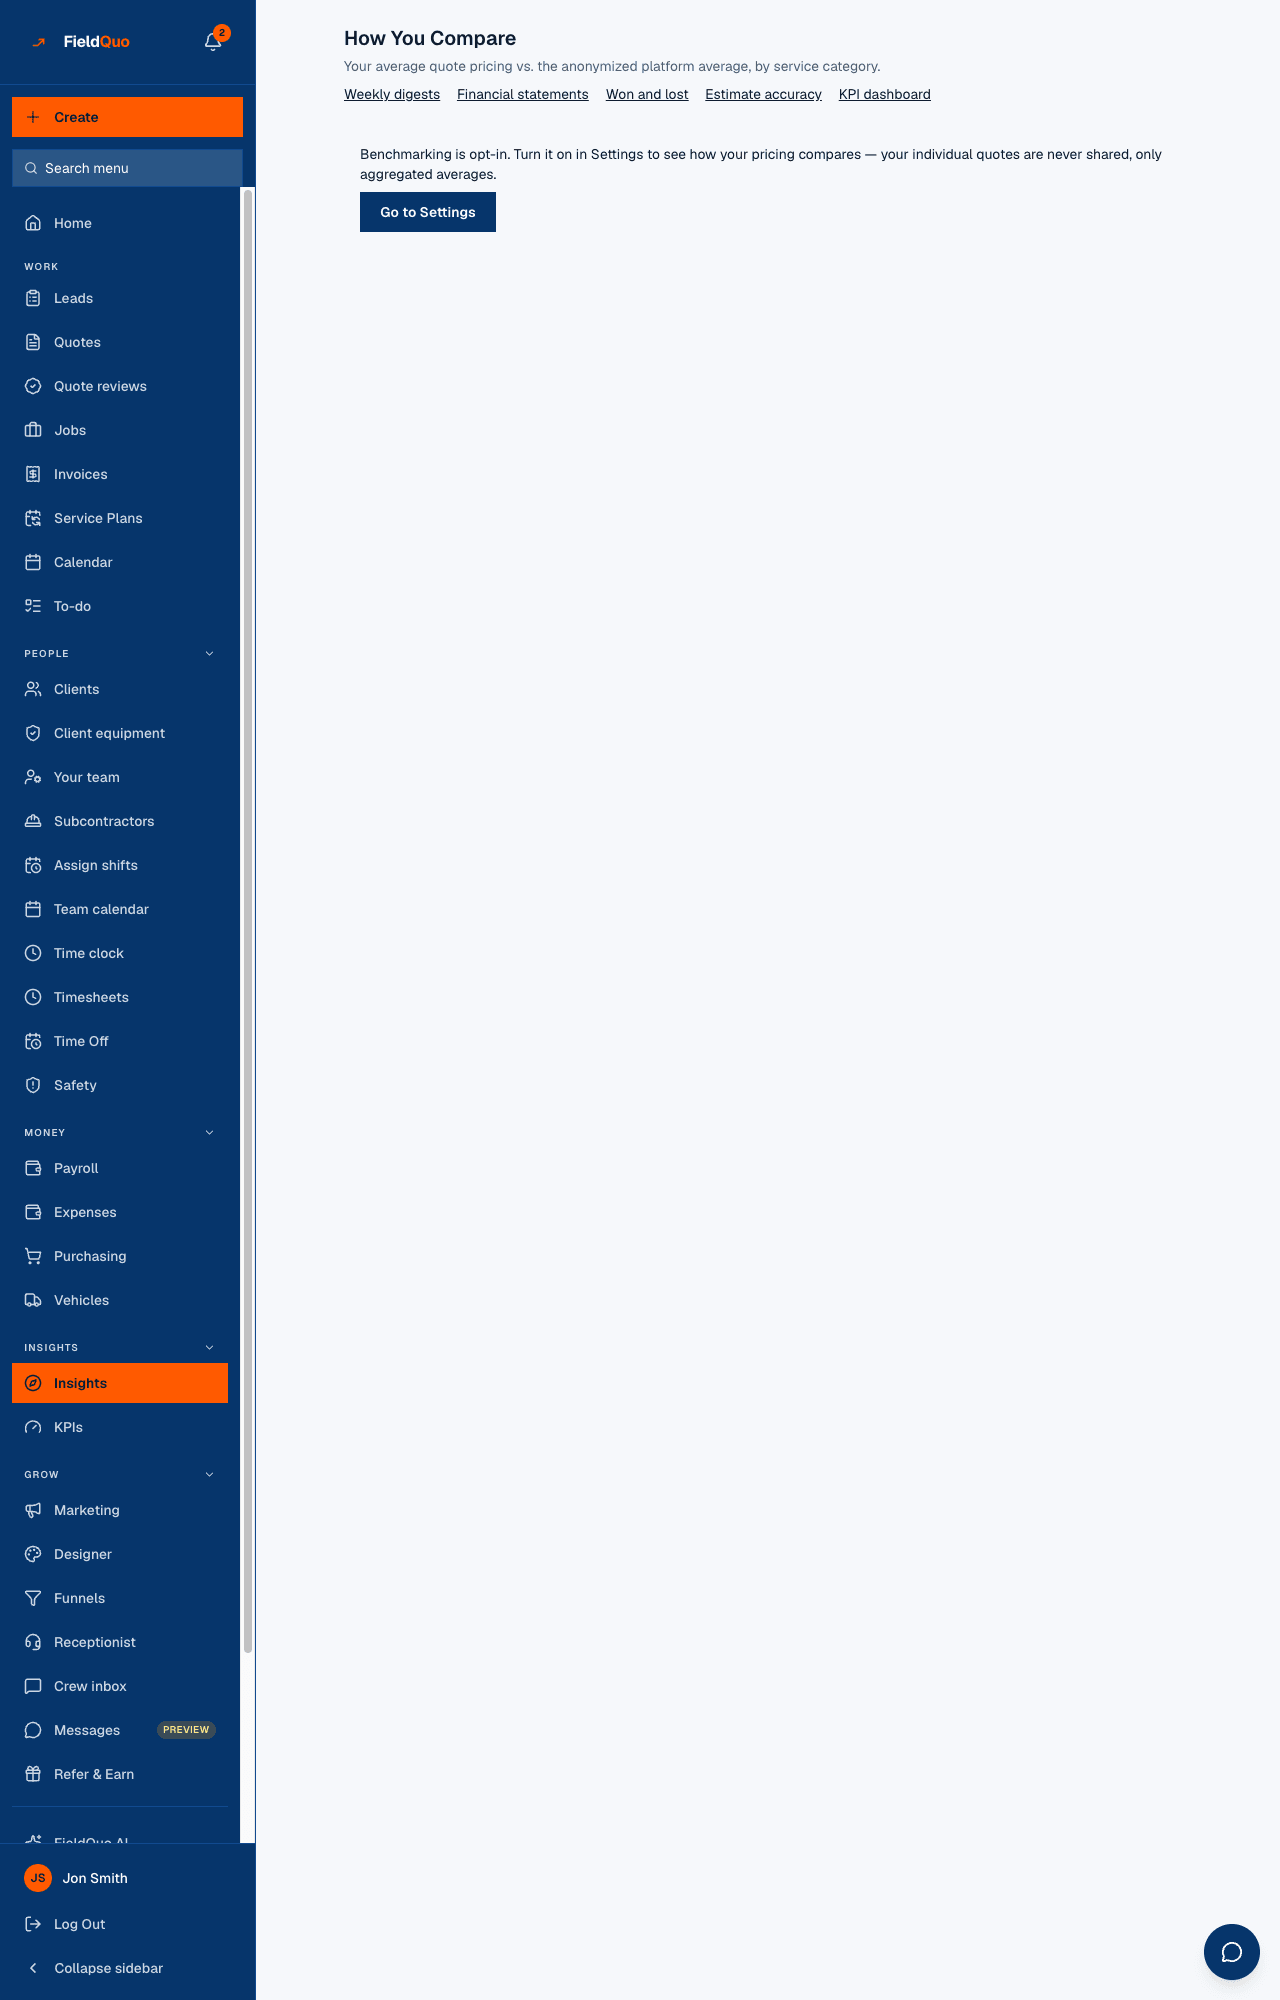
The page is one row per category, under a row of links — Weekly digests, Financial statements, Won and lost, Estimate accuracy, KPI dashboard — because the sidebar has one Insights row for the whole group. Until you opt in, the rows are replaced by “Benchmarking is opt-in. Turn it on in Settings to see how your pricing compares — your individual quotes are never shared, only aggregated averages.” with a Go to Settings button.
How to turn it on
- Open Settings → Company Settings and find the Industry benchmark card.
- Tick Share my anonymized figures to unlock benchmarks and save. The hint under it is the whole deal: “Your numbers are pooled with other companies and never shown individually. You can turn this off any time.”
- Return to Insights. A row appears for every category you have enabled where the platform sample is big enough.
- To leave, untick the box and save. Your figures stop feeding the pool and the page goes back to the opt-in note.
Sharing is symmetric: the pool is built only from companies that ticked the box, so you read it only while you contribute to it.
What is on the screen
| Column | What it is |
|---|---|
| The category, and “61 quotes in your region this quarter” | A service category from Settings → Services, and the size of the platform sample the average is drawn from. |
| Your average | The average priced amount of that category's scope groups across your own quotes. |
| Platform average | The same average across every opted-in company's quotes in that category. |
| The arrow and the percentage | Yours against the platform: green with an up arrow above +3%, amber with a down arrow below −3%, a grey dash in between. A dash with no percentage means there was nothing to compare against. |
How the average is built
- Both averages are taken over scope groups — the sections a quote is grouped into by category — not over whole quotes. A kitchen quote with a cabinets group and a countertop group contributes to two rows.
- A row appears only when you have at least one priced group in that category and the platform has at least 5. Below five, a competitor's price could be recovered from the average, so nothing is published.
- Demo companies are excluded from the pool whatever their own settings say — invented prices do not get to tell a real contractor what the market charges.
- When every group in a sample has no priced amount, the average shows — rather than $0.00, and no percentage is drawn from it.
- The arithmetic today has no date window and no region filter: it averages every priced scope group in the category, across all time, for you and for the pool. The wording of the sample line about region and quarter is ahead of the code.
What the other tools do not do
FieldQuo's comparison pages record what each competitor's own pricing page lists, with the date it was read. None of the five pricing pages tracked — Jobber, Housecall Pro, ServiceTitan, Projul and QuoteIQ — lists a comparison of your prices against other companies on the same platform, so this page appears under “not listed on their pricing page” on every comparison.
That is the whole claim. It does not say the others could not build one; it says they do not sell one on the page a buyer reads.
Who can see it
The page and its endpoint need the See prices switch — every number on it is money, including your own rate card. Crew is refused; Estimator, Dispatcher, Manager, owners and administrators can read it. The opt-in box lives on Company Settings, which needs the people-management permission — Dispatcher, Manager, owner or administrator.
常见问题
Can another company see my quotes?
No. Only an average over at least five scope groups from the pool is ever shown, and a category with fewer than five is not shown at all.
Why is a category missing from the list?
Either you have no priced quote in it, or fewer than five platform quotes exist for it yet. The page says “Not enough platform data yet for your region/category” when nothing qualifies.
Does opting in change what my clients see?
No. It changes nothing on quotes, invoices or the booking page — only whether your figures join the pool and whether this page shows rows.
这篇文章有帮助吗?